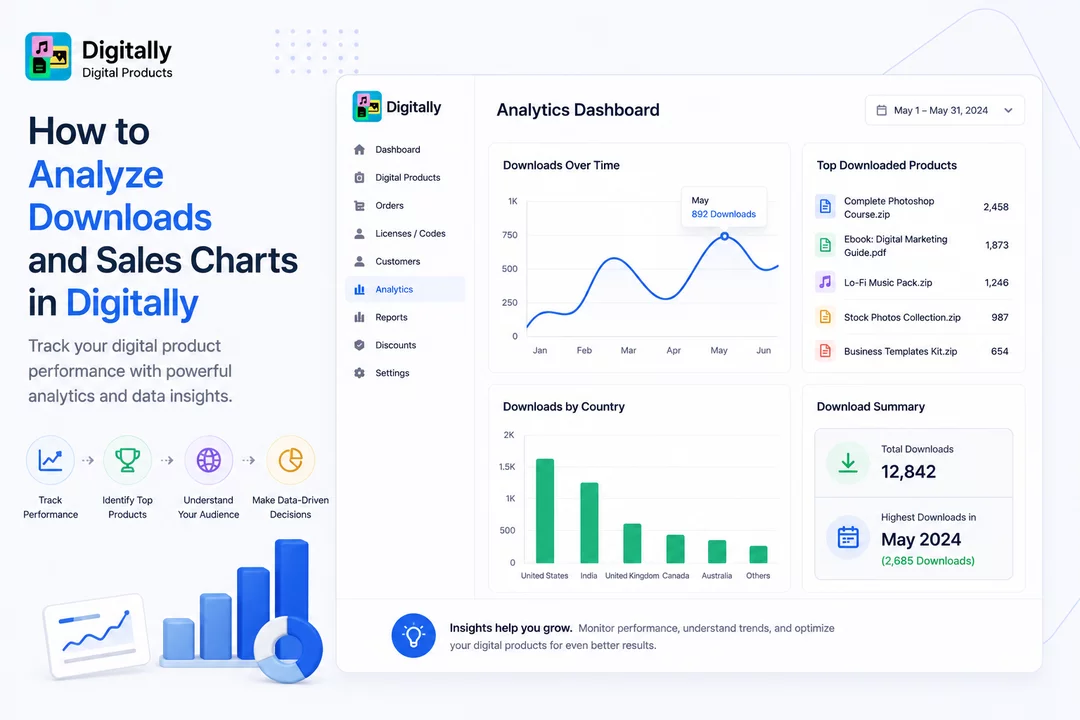
Track your store’s digital product performance with the Analytics Dashboard in Digitally – Digital Products. Here’s how to understand and use your sales and download data effectively.
✅ Step 1: Access the Analytics Page
From your Shopify dashboard, open the Digitally – Digital Products app.
Click on the Analytics tab in the left-hand menu.

✅ Step 2: Explore the Analytics Dashboard
After clicking on Analytics, you’ll be taken to the Analytics Dashboard.
This page gives you a visual overview of your digital product sales, downloads, and performance trends.

✅ Step 3: Downloads Over Time (Wave Chart)
The first card displays a line wave chart showing total downloads across different months.
- Y-axis (Vertical): Number of downloads
- X-axis (Horizontal): Time (by month)
This helps you spot seasonal spikes or slow periods in your downloads.

✅ Step 4: Top Downloaded Products
The second card shows a list of your digital products along with the total number of downloads for each.
This makes it easy to identify your best-performing digital products at a glance.

✅ Step 5: Downloads by Country
The third chart displays a bar graph of downloads segmented by country:
- Y-axis: Number of downloads
- X-axis: Country names
This helps you understand where most of your digital sales are coming from geographically.

✅ Step 6: Download Summary
The final card summarizes:
- Total downloads across all products
- Month with the highest downloads (highlighted for easy insight)

Use this summary to track overall performance and identify peak download periods.
🎉 That’s It!
You’ve now learned how to analyze your store’s digital performance using sales and download insights within the Digitally app. Regularly checking this dashboard helps you make informed decisions about your digital product strategy.